Air Quality Report 6
Instantaneous monitoring of Hydrogen Sulphide
4.1 Monitoring using a Jerome Analyser
A Jerome® J605 Hydrogen Sulphide analyser has been used since 14 March 2024. The hand-held instrument contains a gold film sensor that is sensitive to Hydrogen Sulphide. To take a sample, an internal pump pulls ambient air over the gold film sensor. The sensor absorbs the Hydrogen Sulphide present in the sample and undergoes an increase in electrical resistance proportional to the mass of Hydrogen Sulphide. This allows the instrument to calculate and display the measured concentration of Hydrogen Sulphide. Measurements below 3ppb are reported as zero and at 5ppb the instrument has an accuracy of ±1ppb and a precision of 10%. In practice, this means a displayed value of 0ppb is <3ppb and a reported value of 5ppb is equivalent to an actual concentration of about 4-6ppb. The calibration certificate for the Jerome used is included in Appendix 3.
Using the Jerome, monitoring data has been gathered using several different approaches:
- 30 minute logging of airborne Hydrogen Sulphide at 5-minute intervals – in this mode the instrument takes a measurement automatically every 5 minutes.
- 30 minute logging of airborne Hydrogen Sulphide at 1-minute intervals from 17 June 2024 – in this mode the instrument takes a measurement automatically every 1 minute.
- 24-hr (or more) of logging airborne Hydrogen Sulphide at 1, 5 and 15-minute intervals
- Spot levels – where measurements have been made in real-time at different locations.
These data are presented in this report as parts per billion (ppb).
For each approach the same protocol has been followed with the instrument undergoing a 45-minute ‘regeneration’ process at the start and end of each day, as dictated by the sensor saturation. At the start of each monitoring interval a 5-minute ‘warm-up’ routine with a Zero Air Filter is also undertaken.
4.2 Monitoring in Community
Appendices 4 and 5 contain the results of 30-minute logging undertaken around the Withyhedge Landfill site. This includes the positions referenced D1-D12 and also other positions which are identified. Also included is commentary related to the observation of odour at the time of monitoring including wind speed, wind direction, odour type/source and perceived intensity.
The data reveals very few occurrences of detectable levels of Hydrogen Sulphide or odour perceived to be associated with the landfill in recent weeks.
In addition to the 30-minute measurements, spot measurements have also been made and this data is presented in Appendix 6. During the most recent monitoring period, spot measurements were taken at locations from which complaints had been received by the landfill operator. Measurements were also made at other off-site positions around the landfill. At all of these positions, the Jerome reported zero (<3ppb) except at 11:58 and 12:20 on 2 September when readings of 3.73 and 4.15 ppb were recorded during a thirty-five minute period of sampling close to a position from where a complaint of landfill odour had been received by the operator. Observations at the time noted a gentle breeze of 0.4ms-1 blowing towards Withyhedge Landfill (260 degrees). Additionally, a noticeable odour of horse manure was apparent.
4.2.1 Spittal School
Pembrokeshire Council has recently established a fixed position air quality monitoring instrument in the grounds of Spittal School, as shown in Plate 4-1.
Plate 4-1 Monitor at Spittal School pictured
With the permission of the Council, a Hydrogen Sulphide diffusion tube was placed directly adjacent to the instrument on 11 July 2024; the tube is visible just to the left of the red inverted funnel in Plate 4-1, attached to the fence behind the monitoring unit. As shown in Table 3-2, analysis of the tube (SCH1) failed to detect Hydrogen Sulphide above 0.06 ppb (<0.06 ppb reported).
From 13:25 on 9 August to 0830 on 10 August, the Jerome instrument was set up to automatically log every 5 minutes at the same position as the fixed unit. This was also repeated on 13 August between 13:49 and 14:22 on 13 August at 1-minute intervals. During both periods all values were reported as zero (<3 ppb).
Repeated monitoring from 17:33 on 16 August to 17:31 on 17 August at 1-minute intervals also reported zero (<3 ppb) with the exception of a short period between 07:01 and 07:03 on 17 August 2024 when three consecutive readings of 3.29, 4.03 and 3.42 ppb were recorded, i.e. just above the detection level of the instrument.
All of this data will be discussed in a future report if the data from the monitoring unit is available for comparison.
4.3 Monitoring at Withyhedge Landfill
Alongside the measurement of Hydrogen Sulphide in the community areas, the Jerome has also been used to take spot measurements at positions around the landfill site. This data is also presented in Appendix 6.
Throughout the latest monitoring period during August and early September, Hydrogen Sulphide levels fell below the detection limit of the instrument (3 ppb). Two notable instances where this was not the case and a landfill odour was perceptible were on 16 August and 2 September, directly adjacent to Cell 8. To assess the concentrations present at the time the Jerome was set up to log at 1-minute intervals. The results from this monitoring found levels up to 45 ppb, as shown in Charts 4-1 and 4-2.
Chart 4-1 Logged results at on-site position P10 16th August
Chart 4-2 Logged results at on-site position P10 2nd September
4.4 Review of data
As the data from the Jerome monitor is gathered over short timescales, it is considered appropriate, at this stage, to evaluate the data against criteria intended to enable the assessment of such short-term exposure rather than the longer-term exposure criteria summarised in Table 3-5. Such short-term criteria are sometimes referred to as acute criteria. In the absence of specific UK guidelines, an example of such criteria is presented in Table 4-1 which have been developed by the World Health Organisation (WHO).
Table 4‑1 WHO Air Quality Guidelines
Short-term WHO air quality guideline |
Hydrogen Sulphideguideline value/ppb |
Note |
|
30-minute (average) |
5 |
Short-term odour value protective of odour annoyance. The guideline was developed by a panel of experts following a review of available information and consideration of the odour threshold for hydrogen sulphide which was reported to be in range 0.5 ppb – 130 ppb based on experimental studies at the time. |
|
24-hour (average) |
107 |
This value was derived from studies of eye irritation in humans. |
The monitoring in the community to date indicates that there are several different types of odour present including odour suspected to be from the landfill and odours suspected to be related to a range of agricultural and equine activities.
Many readings of Hydrogen Sulphide reported by the Jerome analyser have been close to or below the detection limit during the latest monitoring period. During monitoring undertaken between 5 August and 04 September 2024 in the community, including the overnight monitoring at Spittal School and 99 local area spot checks, over 2500 measurements of Hydrogen Sulphide were recorded by the Jerome analyser. Of these values, all were zero (<3ppb) apart from eight
- 16 August - one measurement at location D9 and one at D12 of between 3 and 5 ppb during thirty minute sampling at one minute intervals. No odour was perceptible.
- 17 August - three measurements between 3 and 5 ppb were logged during automated monitoring at Spittal School.
- 26 August - one measurement of 5.83ppb was detected at D3 followed by a measurement below 5ppb one minute later. All other one-minute readings at that location were zero (<3ppb) and the 30 minute average less than 5ppb. An odour perceived to be associated with slurry was also perceptible at the time of monitoring.
- 2 September - two measurements below 4.15ppb during spot checks. An odour characteristic of horse manure was discernible.
Far lower levels of Hydrogen Sulphide have also been detected at the landfill site in recent weeks with the majority of values reported as zero (<3ppb) and the maximum <45ppb.
It is evident from the repeated use of the Jerome and recording of odour observations since March 2024 at different times of the day over several sequential days and weeks that odours and the detection of Hydrogen Sulphide are not persistent over such time-frames. In recent weeks, at many monitoring positions on different occasions, the Jerome was not able to detect Hydrogen Sulphide above the level of detection in the community.
All of the Jerome data gathered to date is collectively shown in Charts 4-3 to 4-14. In these time-series charts all of the data gathered at D1-D12 is presented which includes the elevated concentration (117ppb) reported at D2 on 21 March and the elevated values found at D11 on 19 June. These latter values were considered to be associated with vehicular exhaust. When the individual time series plots for each position are considered, it is evident that higher concentrations were detected by the Jerome earlier in the year and during recent weeks very few detectable levels of Hydrogen Sulphide have been detected. At the same time, the occurrence of perceptible levels of odour considered to be associated with landfill gas have fallen. This pattern is also reflected in the total number of complaints received by the operator, as indicated in Chart 4-15
Chart 4-3 All Jerome data gathered at D1 March and September 2024
Chart 4-4 All Jerome data gathered at D2 March and September 2024
Chart 4-5 All Jerome data gathered at D3 March and September 2024
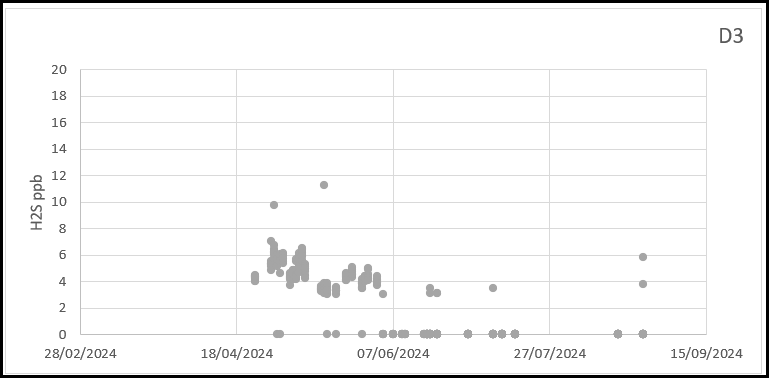
Chart 4-6 All Jerome data gathered at D4 March and September 2024
Chart 4-7 All Jerome data gathered at D5 March and September 2024
Chart 4-8 All Jerome data gathered at D6 March and September 2024
Chart 4-9 All Jerome data gathered at D7 March and September 2024
Chart 4-10 All Jerome data gathered at D8 March and September 2024
Chart 4-11 All Jerome data gathered at D9 March and September 2024
Chart 4-12 All Jerome data gathered at D10 March and September 2024
Chart 4-13 All Jerome data gathered at D11 March and September 2024
Chart 4-14 All Jerome data gathered at D12 March and September 2024
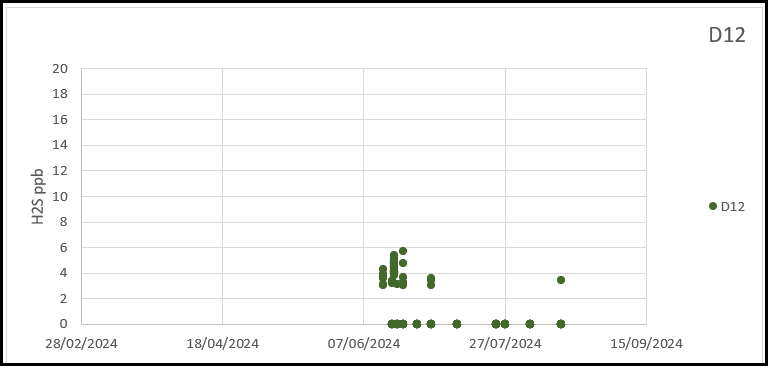
Chart 4-15 Total number of complaints received by operator
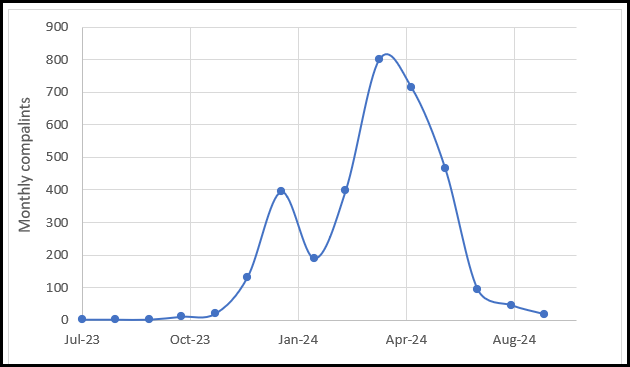
The reader should note that the record of complaints is compiled from raw data and may include complaints related to other issues and not just the incidence of odour. Other complaints may also have been made to other parties such as the Council or NRW.